

A sales manager pulls up her team's activity report on a Tuesday afternoon. Sixty-two calls logged. Eight conversations. The reps were at their desks for seven hours. The math does not add up.
Most sales managers have seen this before. The activity is there, but the output is not. And without a way to measure where the time is actually going, the gap between what the team is doing and what they are producing stays invisible.
At TurboDial, we work with outbound sales teams across insurance, real estate, financial services, and sales-driven agencies. The same pattern appears consistently. Managers are tracking total calls logged, while the metrics that actually reveal productivity losses go unmeasured.
The result is a team that looks busy on paper and underperforms in the pipeline without anyone being able to explain why.
In this article, you will know exactly which sales rep productivity metrics reveal hidden productivity losses and how to determine whether your team's bottleneck is process, list quality, or rep performance.
Why Total Calls Logged Doesn't Measure Sales Rep Productivity
Total calls logged is the most common productivity metric sales managers track. It is also the least useful one on its own.
A rep can log 70 calls in a day and spend fewer than two hours in actual conversations. The remaining five hours go to finding the next number, dialing it, waiting through rings, leaving voicemails, and deciding what the follow-up should be.
The metric that matters is conversation rate: the percentage of calls that resulted in a live conversation. A rep logging 70 calls with a 12 percent conversation rate had fewer than nine real conversations across the entire day. That is the number a sales manager should be looking at.
Five Sales Rep Productivity Metrics That Reveal the Problem
If you want to understand where your team's time is going, these are the metrics worth tracking:
Conversation rate
Calls that connected and resulted in a live conversation are divided by total calls made. A healthy outbound conversation rate typically falls between 15 and 25 percent, depending on list quality and industry.Talk time per session
Total minutes spent in live conversations divided by total session time. If a rep is on the phone for seven hours but actual talk time is under two hours, the remaining five hours are going to mechanics between calls.Voicemail rate
The percentage of calls that reached an answering machine. On most outbound lists, this sits between 60 and 70 percent.Disposition completion rate
The percentage of calls that received a logged disposition. A rate below 90 percent means follow-up automation is failing on at least one in ten contacts.Time between calls
The average time elapsed between one call ending and the next beginning. Anything above 90 seconds on a manual process represents recoverable selling time.
Tracking these sales rep productivity metrics alongside call volume gives a manager a complete picture of where the day is actually going.
What Good Sales Rep Productivity Metrics Look Like on Manual Dialing Teams
You sit down to audit one of your reps' sessions from last week. The call log shows 58 calls over a six-hour session. You pull the talk time data and find 94 minutes of actual conversation. That is one hour and 34 minutes of selling time out of six hours at the desk.
The remaining four and a half hours went to:
Dialing numbers manually and waiting through rings
Leaving the same voicemail 38 times across the session
Logging call notes after each call
Updating contact stages in the CRM
Finding the next contact and deciding what order to work the list
If your rep's talk time is under two hours on a six-hour session, the constraint is almost certainly the process around the calls, and not their effort or skill.
Why Sales Rep Productivity Metrics Look Different on an Automated Process
When the process between calls is automated, the same metrics tell a different story.
A rep working through a progressive dialing session with voicemail drop and automatic logging will typically show:
Talk time of three to four hours on a six-hour session
80 to 120 calls completed in the same window
Voicemail rate unchanged, but delivery time reduced to one click per voicemail
Disposition completion rate at or near 100 percent because the screen appears automatically
Time between calls under 10 seconds with auto-advance enabled
While the conversation rate does not change, the number of opportunities to have a conversation doubles.
The difference lies in how much of their time the process is consuming between each call.
How to Analyze Sales Rep Productivity Metrics
Once you have your team's sales rep productivity metrics, the analysis is straightforward.
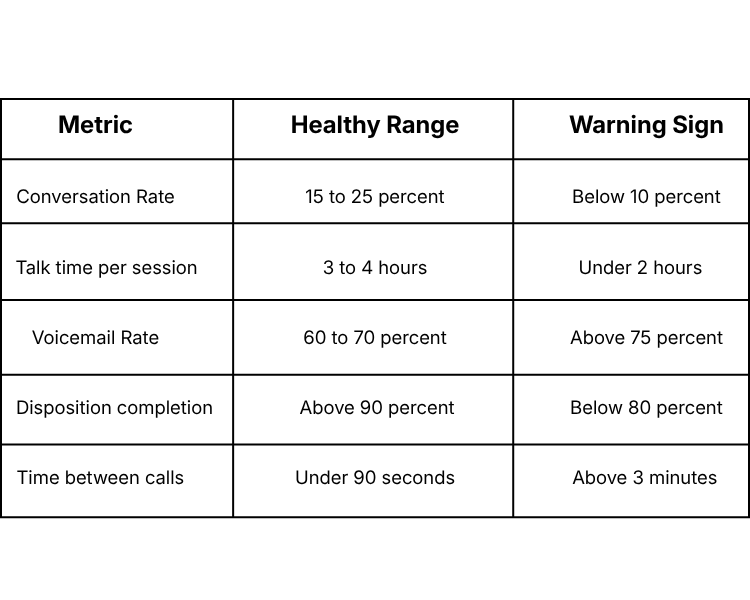
If talk time is under two hours and the time between calls is above three minutes, the process is consuming the day. That is a mechanics problem.
If the conversation rate is below 10 percent despite healthy talk time, the issue is more likely the list quality or timing.
If disposition completion is below 80 percent, follow-up automation is unreliable across a significant portion of your pipeline and compounds every week it goes unaddressed.
What Your Team's Sales Rep Productivity Metrics Are Telling You
The activity reports look fine, and the reps are working. But conversations are low, pipeline movement is slow, and nobody can explain the gap between effort and output.
That gap is measurable. Talk time, conversation rate, disposition completion, and time between calls are the numbers that reveal it. Once you have them, the bottleneck becomes visible.
The teams that close more deals at the same headcount are working inside a process that removes the friction their peers are still fighting every day.
Once you know where the time is going, the fix is structural, and it starts with the process between every call.
At TurboDial, that process is built into every session. The dialer moves through the contact list automatically. The disposition screen appears after every call, so nothing gets skipped. Every interaction logs to the contact record without manual entry. Every outcome fires the correct CRM campaign immediately. The mechanics run themselves, so your reps stay in conversations.
If you are ready to see what changes when that process is rebuilt, read: [How to Increase Sales Productivity Without Hiring More Reps]
Frequently Asked Questions
What are the most important sales rep productivity metrics to track?
Conversation rate, talk time per session, voicemail rate, disposition completion rate, and time between calls. Together, they reveal whether a rep's output gap is a process problem, a list quality problem, or a skill problem.
How do I calculate conversation rate for my sales team?
Divide live conversations by total calls made and multiply by 100. A healthy outbound rate falls between 15 and 25 percent.
What does low talk time tell me about my sales team?
A rep logging under two hours of talk time in a six-hour session is spending most of their day on process overhead between calls.
Why is disposition completion rate important?
Follow-up automation only fires when a disposition is logged. A rate below 80 percent means automation is failing on at least one in five contacts.
How does progressive dialing affect sales rep productivity metrics?
Progressive dialing removes the time between calls by automating the transition from one contact to the next. Talk time increases, time between calls drops to under 10 seconds, and disposition completion approaches 100 percent.